
Artificial lighting of plants in greenhouses
Luminaire FLORA LED 240/1.3
DATA SHEET
Application
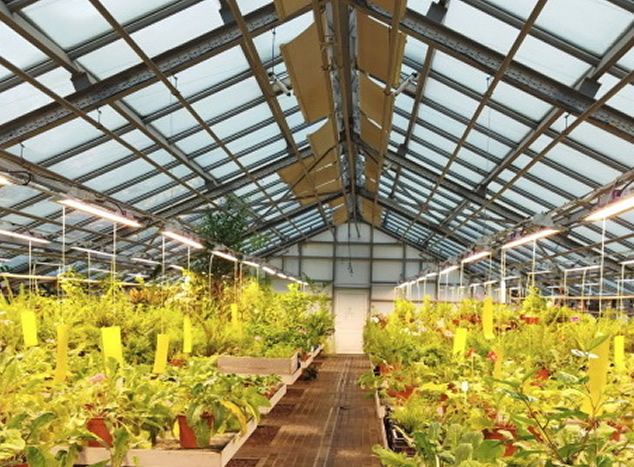
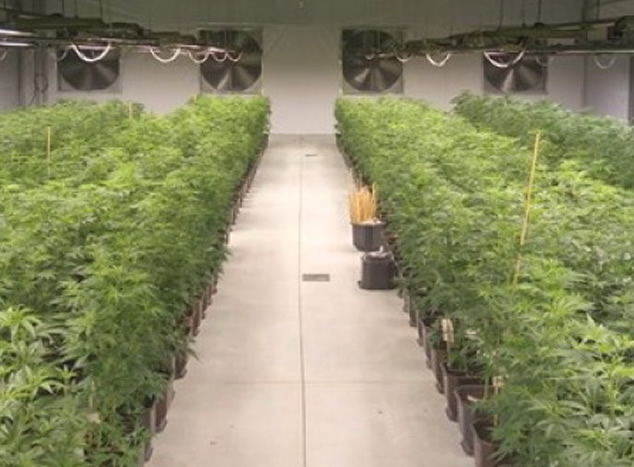
FLORA LED 240/1.3 luminaires are designed to create energy-efficient artificial lighting in greenhouses:
- in addition to natural daylight;
- to control the light period (photoperiodic lighting);
- to completely replace daylight with artificial light (growing without daylight)
Design

Technical parameters
| Parameter | Value | Parameter | Value |
| Radiation flux, W | 120 | Energy efficiency class | A+ |
| Photon flux, µmol/s | 600 | Power factor | 0,98 |
| Input current, A (max) | 1,15 | Enclosure protection rating | IP65 |
| Input voltage, V | 230 | Operation temperature, 0C | +1…+40 |
| Input frequency, Hz | 50 | Weight, kg | 2.7 |
| Power consumption, W | 260 | Dimension, mm | 1300х134х80 |
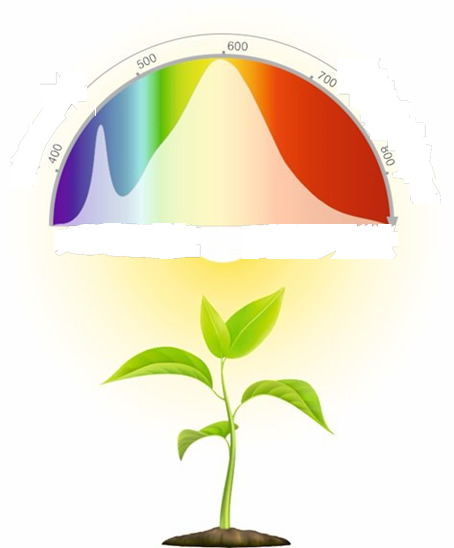
Luminaire emission spectrum
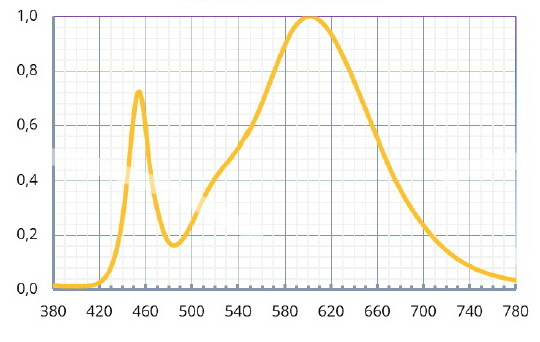
FLORA LED luminaires are a source of optical radiation in a wide range of wavelengths, including in the range of photosyn-thetic active radiation, ensuring the course of the whole variety of photobiological processes inherent in plant organisms.
The nominal service life of the luminaires is 10 years with reliability indicators L90F10 ≥ 60000 hours
(IEC/PAS 62717:2011).
Warranty period of operation – 36 month.
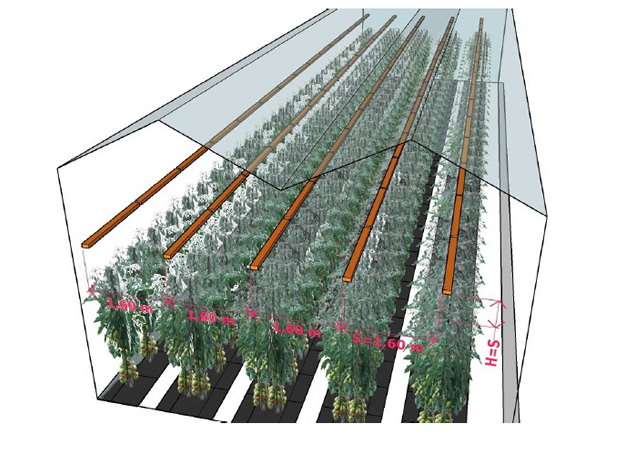
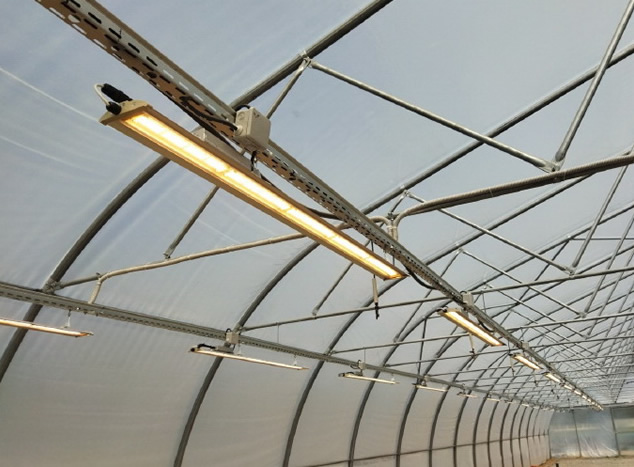
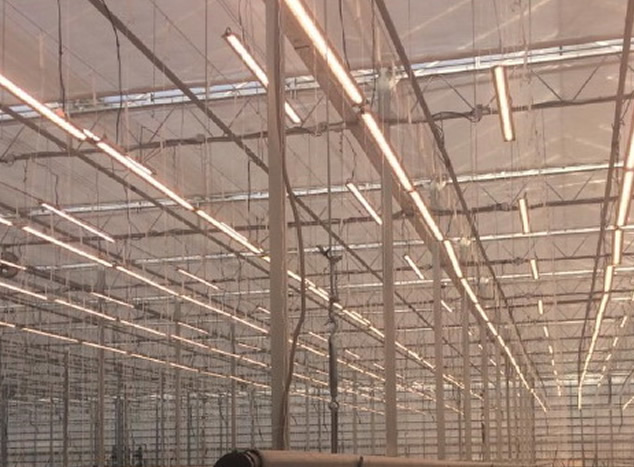
Installation
Luminaires are recommended to be installed in the greenhouse with lines along the axis of symmetry of the trays (rows) with plants, adhering to the geometric ratio: the distance from the plants top to the line of luminaires (height- H) is equal to the distance between the lines of luminaires (spacing-S). With such an arrangement of linear sources of optical radia tion, the optimal irradiation of plants is achieved. For the installation of luminaires in greenhouses, it is recommended to use trays, cables, busbars, using lamp brackets.


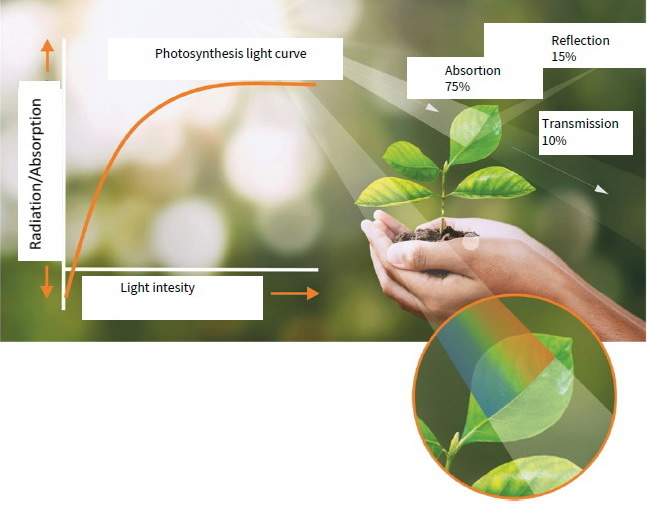
The intensity of photosynthesis strongly depends on the irradiance of the phytocenosis of photosynthetic active ra- diation (photosynthetic irradiance). This dependence is expressed by a logarithmic curve, called the light curve of photosynthesis.
There are three characteristic sections of the photosyn- thesis curve:
01 Straight section up to irradiance level 100…150 W/m2 or 500…750 µmol/m2•s PAR (20000…30000 lx). In this area, the rate of photosynthesis increases in proportion to the increase in irradiance.
02 Curvilinear section up to irradiance level 250…300
W/m2 or 1250…1500 µmol/m2•s PAR (50000…60000 lx). In this area, the rate of photosynthesis slows down, but con- tinues to increase, although not in proportion to the in- crease in irradiance.
03 Straight section. In this area, a further increase in irra- diance does not cause a change in the rate of photosyn- thesis. The latter state is called the state of light saturation. In plants of the temperate zone, light saturation occurs at an irradiance of 100…200 W/m2 or 500…1000 µmol/m2•s PAR (20000…40000 lx).
Photosynthesis light curve
Absortion
75%
Reflection
15%
Transmission
10%
Light intesity
Recommended levels of plant irradiation and daily dose of irradiation
| Plants | DLI (Daily Light Integral) | PPFD | ||
| MJ/m2 | mol/m2 | W/m2 | µmol/m2 •s | |
| Micropropagation of plants | 0,5 – 1,0 | 2,5 – 5,0 | 10 – 20 | 50 – 100 |
| Microgreens, green crops, seedlings | 1,0 – 2,0 | 5,0 – 10,0 | 20 – 40 | 100 – 200 |
| Berry crops | 2,0 – 4,0 | 10,0 – 20,0 | 40 – 80 | 200 – 400 |
| Vegetable crops (tomato, cucumber, pepper) | 4,0 – 8,0 | 20,0 – 40,0 | 80 – 120 | 400 – 600 |
| Parameter | Propagation & Cuttings
14 Days |
Vegetative growth
21 + Days Depending on Strategy |
Veg-to-Flower
Transition 3-7 Days |
Flowering
8-10 weeks Including transition and depending on cultivar |
Stock Plants (mothers) Slow
Growth |
Stock Plants (mothers) Rapid Growth | |
| Average Light
Intensity, µmol/m2*s |
Day | 150 – 200 | 200
Increasing gradu– ally to 450-550 over 21 days |
450-550
Increasing to 700-800 |
700-800 | 350-450 | 500-600 |
| Photoperiod, hours | 18 | 18 | 12 | 12 | 18 | 18 | |
| Daily Light Integral (DLI), mol/m2 | 10 – 13 | Increasing grad- ually from 13 to 30 – 35 | 30 – 35 | 30 – 35 | 23 – 29 | 32 – 39 | |
| Ambient Room
Temp., 0C |
Day | 21-23 | 26-29 | 26-29 | 26-29 | 21-24 | 26-29 |
| Night | 16-21 | 21-24 | 21-24 | 21-24 | 18-21 | 21-24 | |
| Ambient Relative
Humidity (RH) |
Day | 100% until rooted, within 4-
7 days, then vent to 80% |
75-80% (early)
55-67% (mid/late veg) |
55-67% | 55-67% (early)
50-62% (mid/late veg) |
50-60% | 55-67% |
| Night | 100% until rooted, within 4-
7 days, then vent to 80% |
75-80% (early)
55-67% (mid/late veg) |
55-67% | 55-67% (early)
42-57% (mid/late veg) |
50-60% | 55-67% | |
| Vapor Pressure
Deficit, kPa |
Day | 0 | 0.67-1.00 (early)
1.11-1.80 (late) |
1,11-1,80 | 1,11-1,80 (early)
1,28-2,00 (late) |
1,00-1,49 | 1,11-1,80 |
| Night | 0 | 0,50-0,75 (early)
0,82-1,34 (late) |
0,82-1,34 | 0,82-1,34 (early)
1,07-1,73 (late) |
0,83-1,24 | 0,82-1,34 | |
| CO2 Enrichment, ppm | – | 1200-1500 | 1200-1500 | 1200-1500 | 0 | 1200-1500 | |
Here are some lighting recommendations by growth stage, as lighting needs differ between plants in propagation, vegeta- tive, flowering, and stock plant stages. We recommend that growers begin by using FLORA LED with standard spectrum settings. Growers can then adjust spectral ratios and test accordingly to optimize your grow for desired varieties and specific characteristics. Remember, when implementing a smart lighting strategy, it is important to treat light as any other variable and keep testing to determine conditions best for your varieties.
American manufacturer’s recommendations
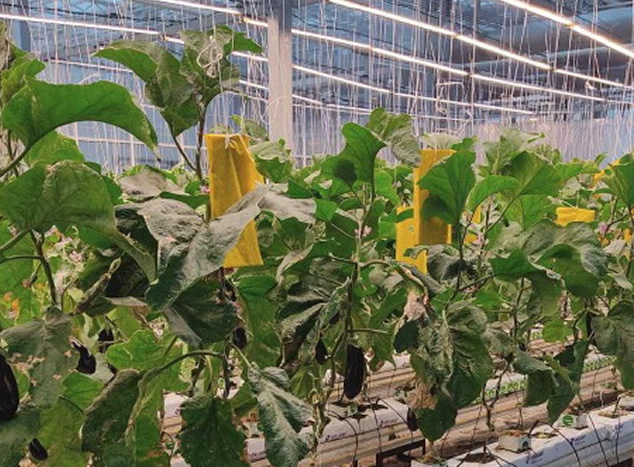
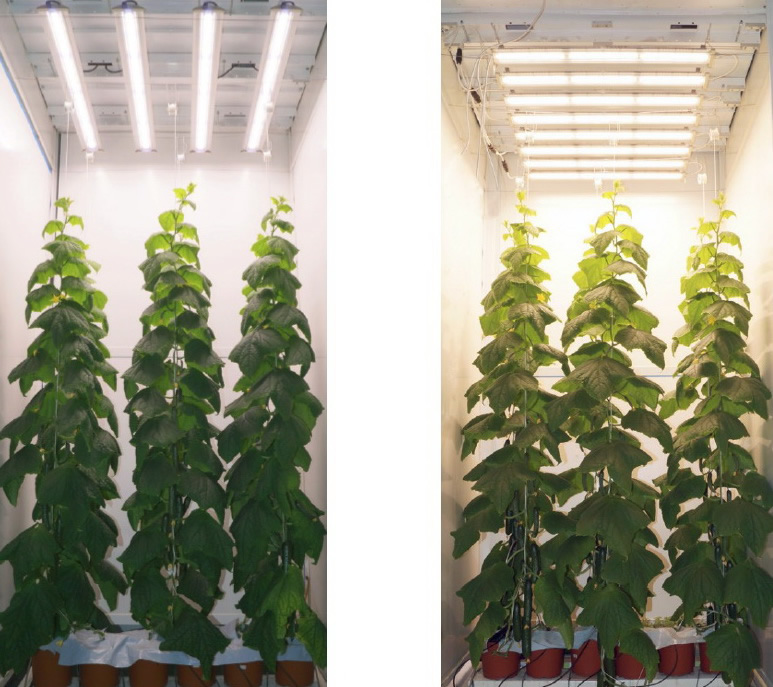
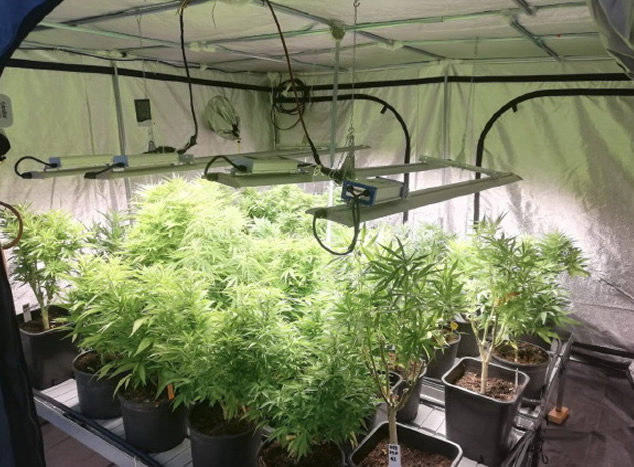
Testing of luminaires FLORA LED in Italy
Planting density 5 plants for 1 m2
Flowering period 55 days of flowering 12/12
Avg. PPFD 330 µmol/m2•s
DLI 14.3 mol/m2
Harvest 1 kg/m2 of fresh flowers (250g/m2 dry flowers)
Recommended greenhouse lighting power
Recommendations for plant growing in glass or film greenhouses
| Parameters | Power level | |||||
| reduced | middle | increased | ||||
| Spacing S between lines of luminaires, m | 2.0 | 1.5 | 1.0 | |||
| Specific power consumption, W/m2 | 100 | 130 | 200 | |||
| PPFD, µmol/m2*s | 225 | 300 | 450 | |||
| Irradiance, W/m2 | 45 | 60 | 90 | |||
| Daily light integral
(DLI) |
Photoperiod, hours | 12 | mol/m2 | 9.7 | 13.0 | 19.4 |
| MJ/m2 | 1.9 | 2.6 | 3.9 | |||
| 14 | mol/m2 | 11.3 | 15.1 | 22.7 | ||
| MJ/m2 | 2.3 | 3.0 | 4.5 | |||
| 16 | mol/m2 | 13.0 | 17.3 | 25.9 | ||
| MJ/m2 | 2.6 | 3.5 | 5,2 | |||
| 18 | mol/m2 | 14.6 | 19.4 | 29.2 | ||
| MJ/m2 | 2.9 | 3.9 | 5.8 | |||
| 20 | mol/m2 | 16.2 | 21.7 | 32.4 | ||
| MJ/m2 | 3.2 | 4.3 | 6.5 | |||
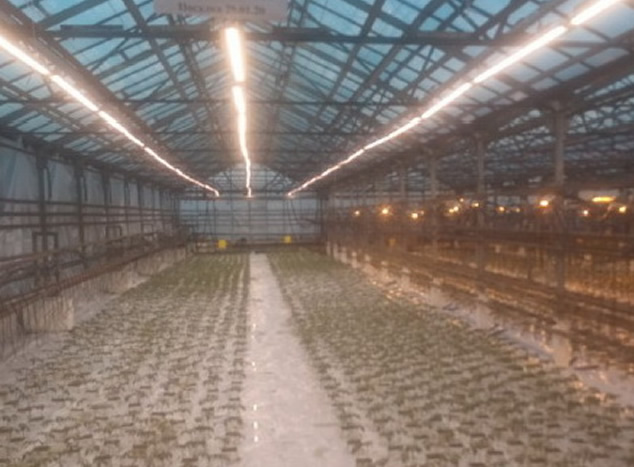
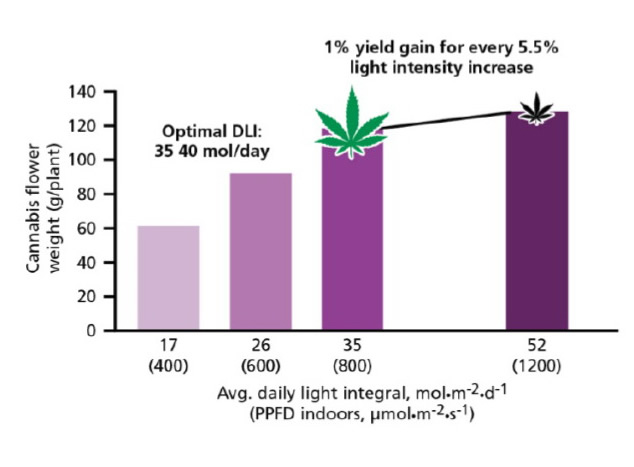
Recommendations for plant growing without sunlight
| Name of parameters | Power level | |||
| reduced | middle | increased | ||
| Spacing S between lines of luminaires, m | 1.0 | 0,65 | 0,5 | |
| Specific power consumption, W/m2 | 200 | 300 | 400 | |
| Daily light integral (DLI) | mol/m2 | 17 | 26 | 35 |
| MJ/m2 | 3.4 | 5.2 | 7.0 | |
| Photoperiod (day), hours | 12 | 12 | 12 | |
| PPFD, µmol/m2*s | 400 | 600 | 800 | |
| Irradiance, W/m2 | 80 | 120 | 140 | |
Approximate solar radiation and photosynthetically active radiation (PAR) in the region under average cloud conditions
| Solar radiation for period | Unit | Month | ||||||||||||
| I | II | III | IV | V | VI | VII | VIII | IX | X | XI | XII | |||
| Month | Total | MJ/m2 | 144 | 188 | 321 | 491 | 678 | 719 | 718 | 629 | 445 | 309 | 162 | 124 |
| PAR | MJ/m2 | 65 | 85 | 144 | 221 | 305 | 324 | 323 | 283 | 200 | 139 | 73 | 56 | |
| mol/m2 | 292 | 381 | 650 | 994 | 1373 | 1456 | 1454 | 1274 | 901 | 626 | 328 | 251 | ||
| Day | Total | MJ/m2 | 4,6 | 6,7 | 10,4 | 16,4 | 21,9 | 24,0 | 23,2 | 20,3 | 14,8 | 10,0 | 5,4 | 4,0 |
| PAR | MJ/m2 | 2,1 | 3,0 | 4,7 | 7,4 | 9,8 | 10,8 | 10,4 | 9,1 | 6,7 | 4,5 | 2,4 | 1,8 | |
| mol/m2 | 9 | 14 | 21 | 33 | 44 | 48 | 47 | 41 | 30 | 20 | 11 | 8 | ||
Note: According to meteorological observations at 43 degrees north latitude
Approximate solar radiation and photosynthetically active radiation (PAR) in the region under average cloud conditions
| Solar radiation for period | Unit | Month | ||||||||||||
| I | II | III | IV | V | VI | VII | VIII | IX | X | XI | XII | |||
| Month | Total | MJ/m2 | 80 | 164 | 342 | 439 | 599 | 642 | 613 | 507 | 308 | 145 | 74 | 51 |
| PAR | MJ/m2 | 36 | 74 | 154 | 198 | 270 | 289 | 276 | 228 | 139 | 65 | 33 | 23 | |
| mol/m2 | 162 | 332 | 693 | 889 | 1213 | 1300 | 1241 | 1027 | 624 | 294 | 150 | 103 | ||
| Day | Total | MJ/m2 | 2,6 | 5,9 | 11,0 | 14,6 | 19,3 | 21,4 | 19,8 | 16,4 | 10,3 | 4,7 | 2,5 | 1,7 |
| PAR | MJ/m2 | 1,2 | 2,6 | 5,0 | 6,6 | 8,7 | 9,6 | 8,9 | 7,4 | 4,6 | 2,1 | 1,1 | 0,7 | |
| mol/m2 | 5 | 12 | 22 | 30 | 39 | 43 | 40 | 33 | 21 | 9 | 5 | 3 | ||
Note: According to meteorological observations at 55 degrees north latitude
Approximate solar radiation and photosynthetically active radiation (PAR) in the region under average cloud conditions
| Solar radiation for period | Unit | Month | ||||||||||||
| I | II | III | IV | V | VI | VII | VIII | IX | X | XI | XII | |||
| Month | Total | MJ/m2 | 37 | 94 | 261 | 374 | 590 | 634 | 596 | 432 | 237 | 104 | 36 | 18 |
| PAR | MJ/m2 | 17 | 42 | 117 | 168 | 266 | 285 | 268 | 194 | 107 | 47 | 16 | 8 | |
| mol/m2 | 75 | 190 | 529 | 757 | 1195 | 1284 | 1207 | 875 | 480 | 211 | 73 | 36 | ||
| Day | Total | MJ/m2 | 1,2 | 3,4 | 8,4 | 12,5 | 19,0 | 21,1 | 19,2 | 13,9 | 7,9 | 3,4 | 1,2 | 0,6 |
| PAR | MJ/m2 | 0,5 | 1,5 | 3,8 | 5,6 | 8,6 | 9,5 | 8,7 | 6,3 | 3,6 | 1,5 | 0,5 | 0,3 | |
| mol/m2 | 2 | 7 | 17 | 25 | 39 | 43 | 39 | 28 | 16 | 7 | 2 | 1 | ||
Note: According to meteorological observations at 60 degrees north latitude
